Using the London bus accidents data, I conducted an in-depth analysis to identify key areas and sections that provide valuable insights. By leveraging this information, I developed a live interactive dashboard using Tableau. The dashboard presents a comprehensive overview of the accidents, allowing users to explore and gain insights into the patterns, contributing factors, and high-risk areas. This visual representation enhances understanding and facilitates data-driven decision-making to improve safety measures and reduce accidents in London’s bus transportation system.
Outcome
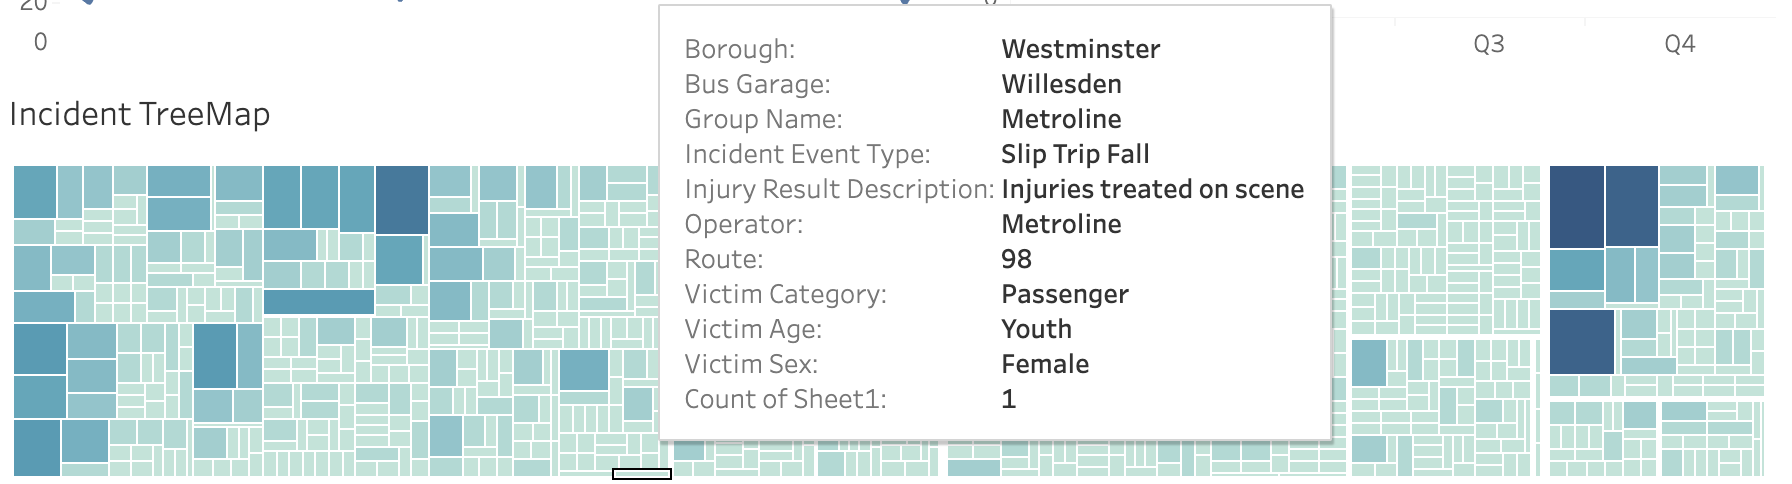
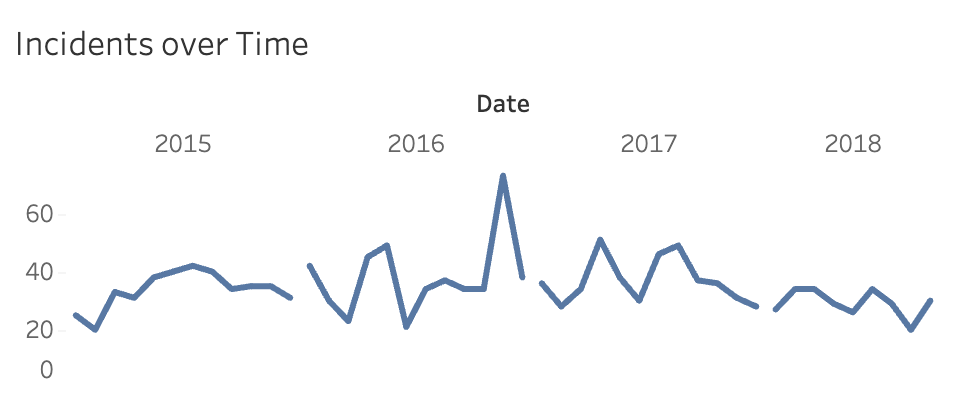
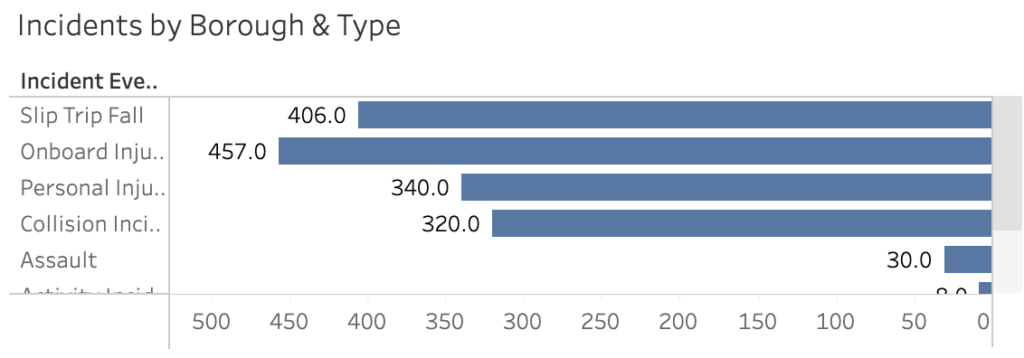
The outcome of my project is a live interactive dashboard created in Tableau, utilizing the London bus accidents data. The dashboard offers a comprehensive visualization of the data, allowing users to gain valuable insights into the areas and sections with a higher frequency of accidents. By exploring the interactive features, users can identify patterns, contributing factors, and potential risk areas in order to develop targeted strategies for improving safety in London’s bus transportation system. This project aims to enhance awareness and facilitate data-driven decision-making to mitigate accidents and ensure the well-being of passengers and pedestrians.