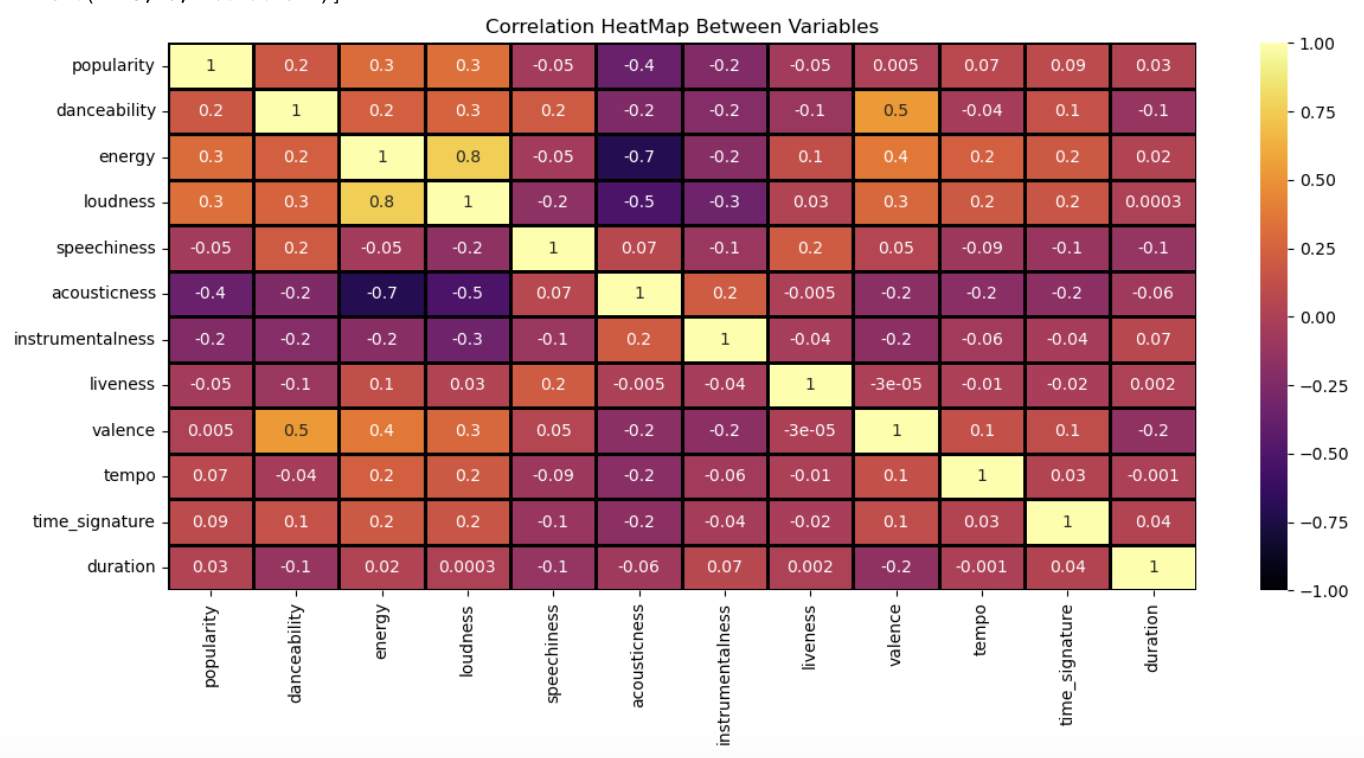
Using Spotify’s music data, I employed Python along with the data visualization libraries Matplotlib and Seaborn to analyze and visualize the information, uncovering fascinating insights. Through data processing and exploratory analysis, I gained a comprehensive understanding of the dataset’s attributes and features. By creating visually appealing plots and charts, I effectively conveyed patterns, trends, and correlations within the data, providing viewers with captivating and easily understandable visualizations. This analysis allowed me to derive valuable insights into the music industry and its various dynamics.
Click on the Project Link to access the full project.
Outcome
After completing this project, I obtained astonishing insights and visually captivating visualizations, which provided a deeper understanding of the Spotify music data. The analysis shed light on key patterns, trends, and relationships within the dataset, offering valuable knowledge and a new perspective on the music industry.